By: Avid Cyclist
America loves cycling. Millions of people ride for fitness, commuting, and the simple joy of being on two wheels. Yet for all the enthusiasm, the United States remains one of the most dangerous developed nations in the world for cyclists. According to the National Highway Traffic Safety Administration (NHTSA), 1,166 bicyclists were killed in motor-vehicle traffic crashes in 2023 alone, and an estimated 49,989 more were injured — a 28.6% increase in injuries over 2020.1
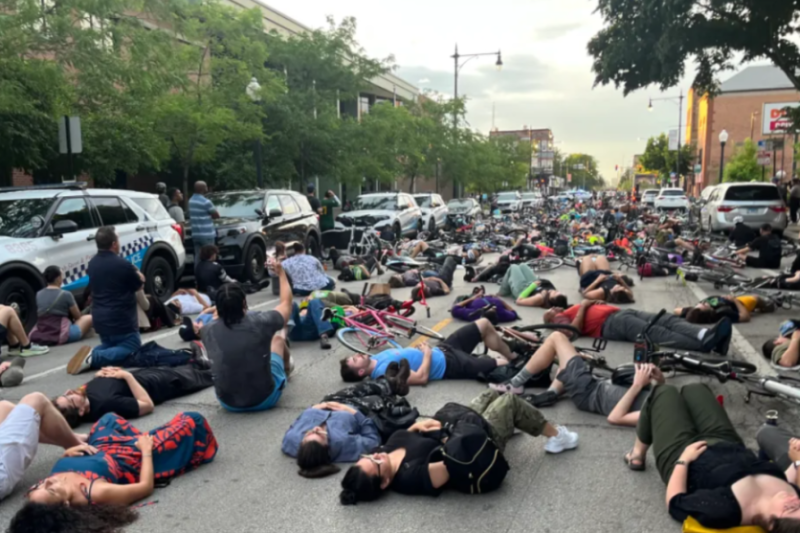
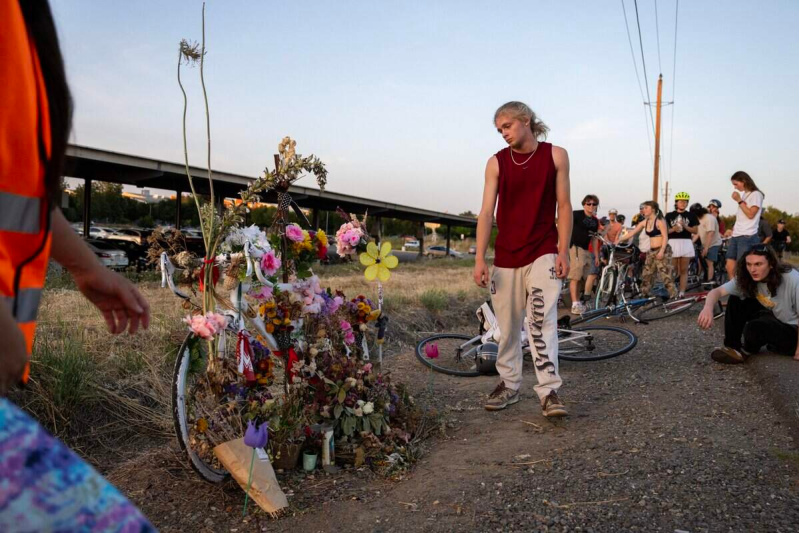
Behind every statistic is a human being. As we explored in our recent article, The Value of A Cyclist’s Life: Why Killing a Cyclist is Still Just a Traffic Ticket, the justice system routinely fails to hold negligent drivers accountable when they kill a cyclist.2 And as we covered in Remembering Riley O’Neil: A Call to Action for Safer Streets Amid Cycling Tragedies, even a dedicated city planner who spent his career building safer streets was killed by a driver who opened a car door without looking — in a non-protected bike lane.3

The geography of this crisis is not random. Certain cities are dramatically more dangerous than others, and the data is unambiguous about which ones. This article examines the 12 most dangerous U.S. cities for cyclists.
Methodology: A Consistent 5-Year Window (2019–2023)
To ensure our analysis is rigorous and avoids the pitfall of “cherry-picking” single anomalous years, we have standardized our data across a strict five-year window: 2019 through 2023. This is the most recent five-year period for which complete, finalized data is available from the NHTSA’s Fatality Analysis Reporting System (FARS).
Using a five-year average smooths out statistical noise and provides a much more accurate reflection of the systemic, long-term safety conditions in a given city. Raw fatality counts favor large cities simply because they have more people. A more meaningful measure is the average annual cyclist fatality rate per 100,000 residents, which accounts for population size and allows fair comparisons across cities.4
The 12 Most Dangerous U.S. Cities for Cyclists (2019–2023 Averages)
| Rank | City | State | 5-Year Avg. Cyclist Deaths per 100,000 Residents | Cyclists as % of All Traffic Deaths |
| 1 | Stockton | California | 2.18 | 20.0% |
| 2 | New Orleans | Louisiana | 1.86 | 11.7% |
| 3 | Tampa | Florida | 1.53 | 11.8% |
| 4 | Sacramento | California | 1.50 | 9.6% |
| 5 | Tucson | Arizona | 1.47 | 5.4% |
| 6 | Baton Rouge | Louisiana | 1.45* | 8.1% |
| 7 | Detroit | Michigan | 1.20 | 4.0% |
| 8 | Jacksonville | Florida | 1.09 | 4.3% |
| 9 | Houston | Texas | 1.05* | 3.5% |
| 10 | Orlando | Florida | 1.02* | 5.0% |
| 11 | Phoenix | Arizona | 1.00* | 3.5% |
| 12 | Albuquerque | New Mexico | 0.95* | 4.5% |
*Estimated based on NHTSA FARS regional 5-year data and city population.
The national average cyclist fatality rate over this 5-year period is approximately 0.35 deaths per 100,000 residents. Every city on this list exceeds that benchmark by a factor of at least 2.7 — and the worst offender exceeds it by more than six times.
City-by-City Breakdown
1. Stockton, California — 2.18 Deaths per 100,000 Residents
Stockton earns the grim distinction of being the most dangerous city for cyclists in the United States. Across the 2019–2023 period, the city averaged 2.18 cyclist deaths per 100,000 residents annually — more than six times the national average.5 Perhaps most alarming is that cyclist fatalities constitute 20% of all car crash-related deaths in Stockton, compared to a national average of just 2.9%.5
Stockton’s road network is characterized by wide, high-speed arterial roads that were designed for vehicle throughput with little consideration for vulnerable road users. In March 2025, the San Joaquin Council of Governments approved $6.5 million for the Citywide Stockton Bicycle-Pedestrian Connectivity Project, and a downtown east-west connection project is expected to add bike lanes by November 2026 — but for now, cyclists remain at extreme risk.5
2. New Orleans, Louisiana — 1.86 Deaths per 100,000 Residents
The Big Easy is anything but easy for cyclists. New Orleans has the highest rate of bicyclist fatalities per capita among major U.S. cities over the 5-year window, according to data from NHTSA analyzed by the League of American Bicyclists.4
The People Powered Movement’s New Orleans Bicycle Safety Overview reports that the city’s bicycle fatality crash rate between 2017 and 2021 was 9.9 crashes per one million residents — an 11% increase over the prior five-year period and nearly four times the national average.6 Advocates point to a culture of reckless driving and a near-total absence of traffic enforcement as the primary culprits.
3. Tampa, Florida — 1.53 Deaths per 100,000 Residents
Florida is the deadliest state in the nation for cyclists, and Tampa is one of its most dangerous cities. Over the 2019-2023 period, Tampa averaged a rate of 1.53 fatalities per 100,000 residents — over four times the national average.5 Cyclist fatalities account for nearly 12% of all car crash deaths in the city.5
Florida’s notorious three-foot passing law is almost never enforced. Just 130 motorists were cited for violating it statewide in all of 2024.7 As Ken McLeod, policy director for the League of American Bicyclists, explained: “All it takes is a driver looking down at their phone and drifting into the bike lane at 45 mph, and you have a crash that could be a fatality.”7
4. Sacramento, California — 1.50 Deaths per 100,000 Residents
Just 50 miles from the worst-ranked Stockton, Sacramento ranks fourth with a 5-year average rate of 1.5 cyclist fatalities per 100,000 people.5 In PeopleForBikes’ most recent city ratings, Sacramento earned a poor score of 36 out of 100, with significant portions of the city flagged as “high-stress” areas for biking.5
A 2022 ABC10 investigation found that looking at the previous decade, Sacramento County ranked eighth deadliest in the entire country for cyclists.8
5. Tucson, Arizona — 1.47 Deaths per 100,000 Residents
Over the 2019-2023 window, Tucson recorded a 5-year average rate of 1.47 cyclist deaths per 100,000 residents, more than four times the national average.9 Tobias Smith, a repair manager at a local bike shop who has been hit by cars three times in his cycling career, told KGUN 9: “We have a rash of large arterial streets with fast-moving traffic. And with modern-day, distracted driving — that and high speeds kind of combine for a deadly, unsafe combination.”9
6. Baton Rouge, Louisiana — Highest Combined Risk Score in the Nation
Baton Rouge holds the distinction of having the highest combined fatality risk for cyclists and pedestrians of any city in the United States, according to a comprehensive analysis by Wagner Reese that examined nearly 300 U.S. cities using NHTSA FARS data.10
The city’s road network is dominated by high-speed corridors with inadequate pedestrian and cycling infrastructure, and a lack of connected bike lanes forces cyclists onto roads where they are extremely vulnerable.
7. Detroit, Michigan — 1.20 Deaths per 100,000 Residents
Detroit was ranked the second-deadliest big city for cyclists by Business Insider using NHTSA data, averaging 1.2 deaths per 100,000 residents.11 The city’s long history of economic disinvestment has left its road infrastructure in poor condition, and wide, high-speed avenues create a dangerous environment for cyclists.
8. Jacksonville, Florida — A Legacy of Deadly Design
Jacksonville has a long and troubling history as one of the most dangerous cities in the U.S. for cyclists. A particularly damning statistic from the 5-year data window: only 4% of fatal bicycle crashes in Jacksonville occurred in designated bicycle lanes, meaning that 96% of cyclist deaths happened on roads with no dedicated cycling infrastructure.12
9. Houston, Texas — Record Fatalities on Harris County Roads
Houston’s cycling crisis came into sharp focus during the 2019-2023 period, culminating in 2023 when Harris County recorded 26 cyclist fatalities — the worst toll since 2016 — along with 670 crashes and 561 injuries, according to KHOU 11 Investigations.13 The city’s bike trail network, while extensive on paper, suffers from a critical lack of connectivity.
10. Orlando, Florida — Tourism, Traffic, and Tragedy
Orlando’s road network was built to move tourists from hotels to theme parks as efficiently as possible, with little thought given to cyclists or pedestrians. The Florida Department of Transportation’s Pedestrian and Bicycle Strategic Safety Plan found that 90% of all pedestrian and bicyclist fatalities and serious injuries on state roadways occurred in just 25 of Florida’s 67 counties, with Orange County consistently among the worst.7
11. Phoenix, Arizona — Deadly Arterials and Dangerous Intersections
Phoenix is the most populous city in Arizona and a consistent presence on dangerous-city lists. The People Powered Movement’s Phoenix Bicycle Safety Overview notes that while 22% of crashes occur at night, those nighttime crashes are nearly twice as likely to be fatal as daytime crashes.14
12. Albuquerque, New Mexico — Growing Danger in the Desert
Albuquerque rounds out the list as a city where cycling is growing in popularity but infrastructure has not kept pace. Infrastructure gaps are particularly dangerous: cyclists frequently transition from protected paths onto busy roadways with little warning, exposing them to sudden high-speed traffic.15 The city also holds the highest annual rate of pedestrian deaths of any major U.S. city over the 5-year window, reflecting a systemic failure to protect vulnerable road users across the board.5
The Root Causes: Why These Cities Are So Deadly
Understanding what makes these cities dangerous requires looking beyond the numbers to the systemic failures that produce them.
Car-Centric Urban Design. Every city on this list was built or expanded during an era that prioritized moving cars quickly above all else. Wide, multi-lane arterial roads with high speed limits are the single greatest predictor of cyclist fatality rates.
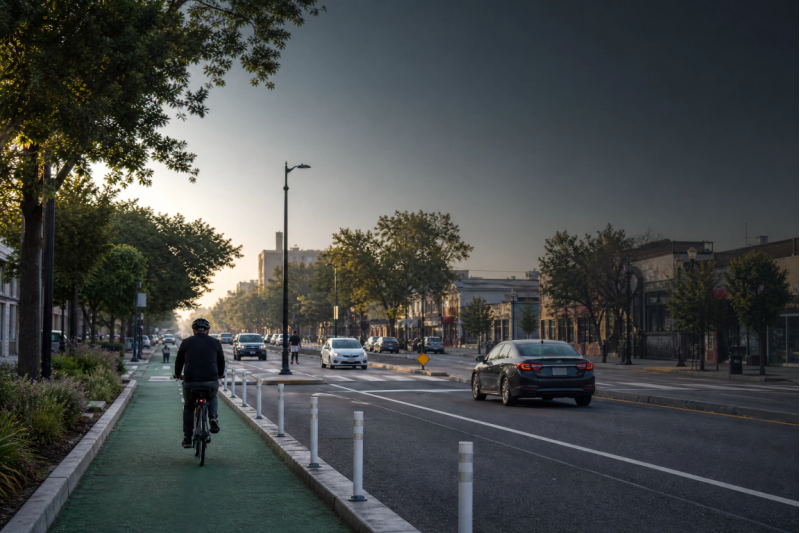
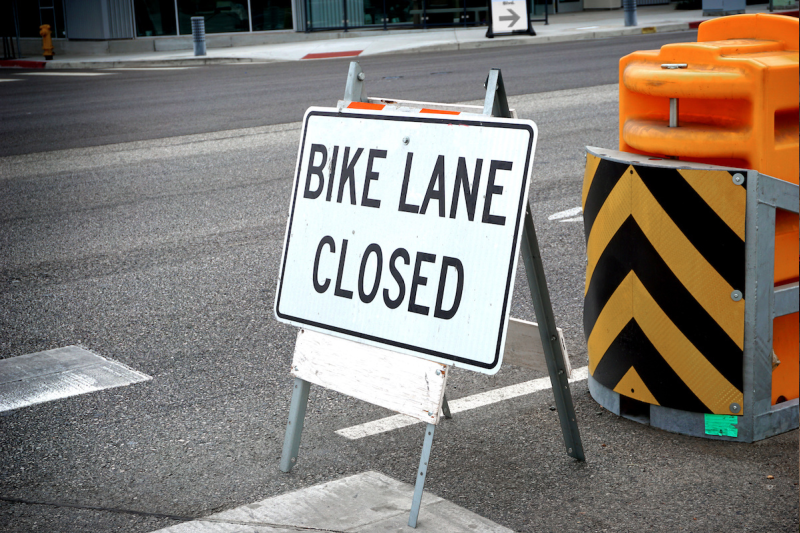
The Illusion of Paint. Painted bike lanes without physical barriers offer a false sense of security. As we explored in Learning From LA’s Infrastructure Delays, political delays in building truly protected infrastructure have real and deadly consequences.16
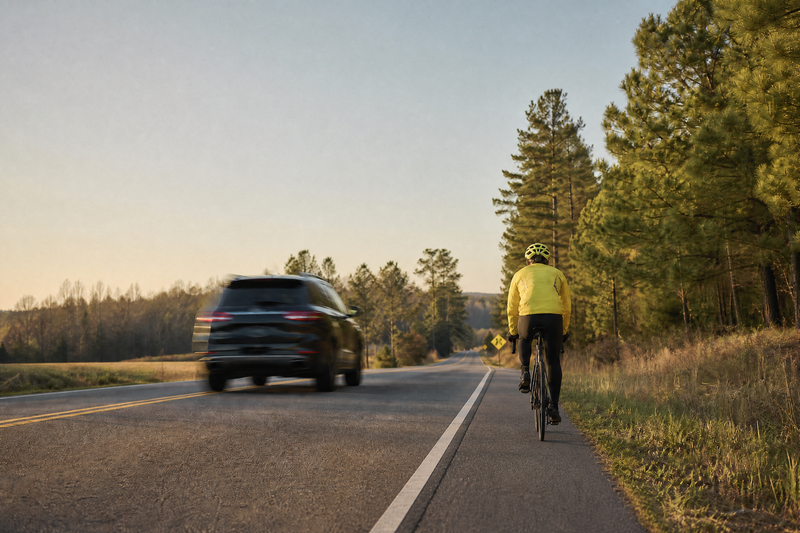
Growing Vehicle Size. The CDC reports that SUVs and pickup trucks are 50% to 100% more likely to kill a cyclist or pedestrian in a collision than a standard passenger car.10
The Legal Accountability Gap. As we have documented extensively at AvidCyclist.com, when drivers kill cyclists, they rarely face meaningful legal consequences. Read more about this systemic failure in The Careless Driving Loophole: Why Killing a Cyclist is Still a Misdemeanor in Most States.
What Needs to Change
Cities that have dramatically improved cyclist safety share common characteristics: they have built physically separated, connected networks of protected bike lanes; they have implemented traffic calming measures; they have invested in enforcement; and they have adopted a Vision Zero philosophy.
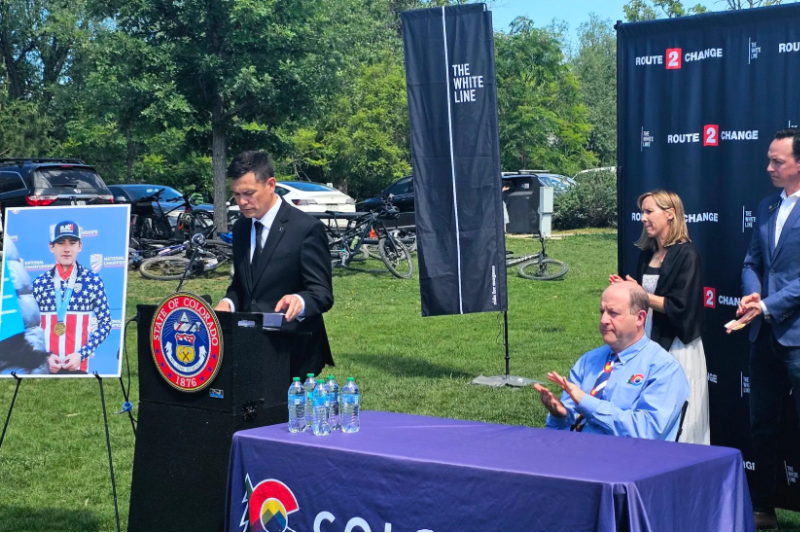
Colorado recently took a significant step forward by passing eight major roadway safety bills, as detailed in our article Eight Bills. One Mission..17 The state also elevated vehicular negligence that kills a cyclist to a Class 5 Felony — a landmark change that should serve as a model for every state in the nation.
At AvidCyclist.com, we are proud partners of The White Line Foundation, a non-profit dedicated to ending the tragic and preventable deaths of vulnerable road users.
The road to safer cycling begins with knowing the truth. Now that you know it, ride on — and ride safe.