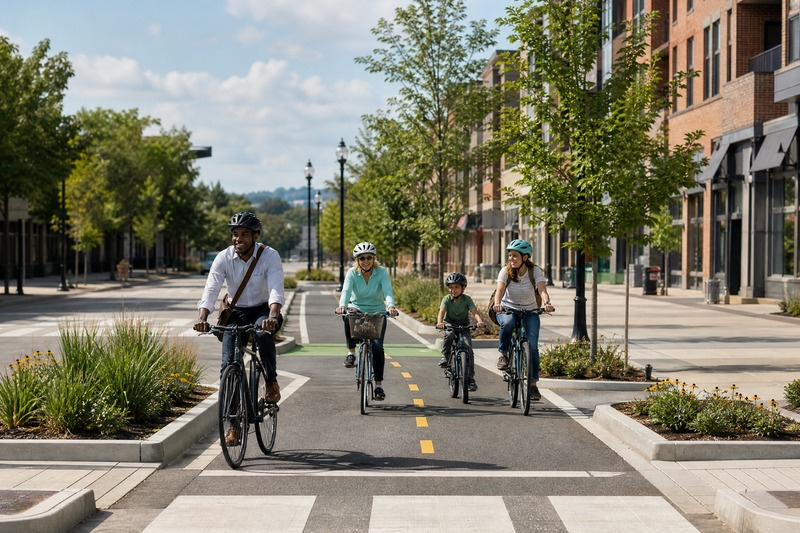
For urban and suburban cyclists across the United States, the quest for safe, connected routes is a daily reality. The 2026 PeopleForBikes City Ratings reveal a significant shift in this landscape, with 555 U.S. cities now scoring 50 or higher . This marks a substantial jump from just 234 cities reaching that milestone in 2025 . But what does a score of 50 actually mean? In the context of the City Ratings, it represents a critical tipping point. When a city hits this threshold, its low-stress network is generally connected enough to generate real momentum for broader “bikeability”, encouraging more people to ride for everyday trips . The ratings rely on the Bicycle Network Analysis (BNA) tool, which measures how easily people can reach everyday destinations via safe, low-stress routes .
Editor’s Note: As cities navigate infrastructure improvements, federal funding remains a critical piece of the puzzle. See our August 19 coverage on the federal bike-lane fight for more context on national funding challenges.
Understanding the 2026 Methodology Updates
Before celebrating a sudden explosion of new bike lanes, it is essential to understand that the dramatic jump in scores is partly due to comprehensive methodology updates, rather than just overnight infrastructure changes . Year-over-year comparisons must account for these baseline adjustments .

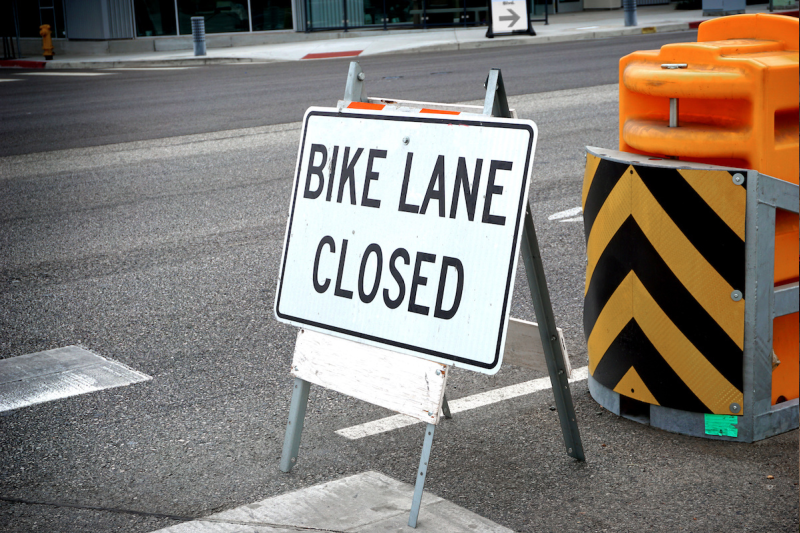
Under updated guidelines, conventional bike lanes require speed limits of 20 mph or lower to be considered low-stress.
The 2026 ratings evaluated a total of 3,019 U.S. communities . A key change in this year’s methodology is the incorporation of 2020 Census data, allowing for more accurate population weighting and job location tracking . Crucially, the ratings have adopted stricter NACTO guidelines. Under these updated standards, conventional painted bike lanes are no longer automatically considered low-stress; they now require speed limits of 20 mph or lower to meet that classification . The analysis also now excludes destinations outside city limits and physically inaccessible areas, providing a more realistic picture of a rider’s actual network .
What the Top Cities Have in Common (The SPRINT Framework)
Despite the stricter methodology, several cities stand out as national leaders. In the 2026 rankings, Brooklyn, NY, leads the large city category with a score of 70 . Hoboken, NJ, tops the medium cities with an 83, and Mackinac Island, MI, achieved a perfect 100 among small cities .
What do these high-performing cities share? The answer lies in the SPRINT framework, which outlines the common characteristics of successful bike networks:
| SPRINT Principle | Description |
| Safe Speeds | Default residential limits of 25 mph or lower. |
| Protected Bike Lanes | Physical separation from motor traffic. |
| Reallocated Space | Repurposing road space for biking and walking. |
| Intersection Treatments | Clear markings and physical protections at crossings. |
| Network Connections | Filling gaps rather than building isolated projects. |
| Trusted Data | Using objective metrics to guide infrastructure decisions. |

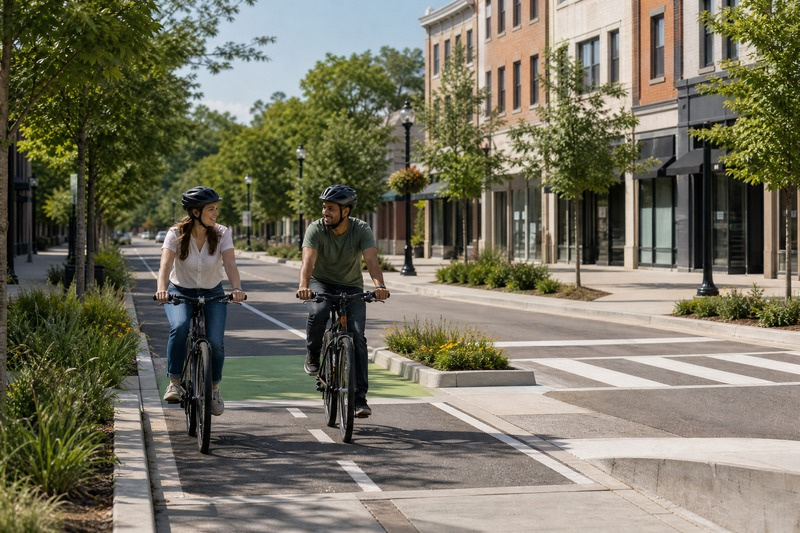
High-scoring cities implement SPRINT principles, including safe intersection treatments and reallocated space.
The SPRINT framework emphasizes that taking a network approach to fill gaps is far more effective than building isolated, piecemeal projects . A physically protected lane is only as good as the intersections it crosses and the neighborhoods it connects.
Editor’s Note: For a deeper understanding of why physical separation is crucial for rider safety and legal protection, review our August 25 cycling-liability explainer.
How to Help Your City Improve
While 555 cities broke the 50-point barrier, nearly 500 cities currently fall into the “on the cusp” 40–50 score range . If your city is one of them, there are actionable steps you can take to advocate for improvement.
First, focus on speed. The data shows that high residential speed limits are a major barrier to scoring above 50 . Advocating for lower default residential speed limits (25 mph or ideally 20 mph) is one of the most effective ways to instantly upgrade the safety and low-stress classification of existing neighborhood routes.
Second, push for network connectivity rather than just demanding “more bike lanes.” Use the publicly available BNA data to identify specific gaps in your local access to jobs, retail, or transit . When engaging with local planners and officials, use the SPRINT framework to guide constructive conversations. Ask how proposed projects fit into the broader network and whether they include safe intersection treatments.
The 2026 PeopleForBikes City Ratings demonstrate nationwide momentum for safe, connected infrastructure . While methodology updates played a role in the increased scores, the data clearly shows what works. By focusing on safe speeds, protected lanes, and network connectivity, sustained investment and targeted advocacy can push even more cities past the 50-point tipping point in the coming years .