By Andrew Simons, The White Line
When I started analyzing nearly two decades of North Carolina crash data, I expected to find dangerous intersections, high-risk counties, and familiar hotspots.

Those are certainly there. But after months of digging through the numbers, mapping crashes across legislative districts, counties, municipalities, school zones, and road types, one finding kept resurfacing. It explained nearly every pattern I was seeing:
Speed.
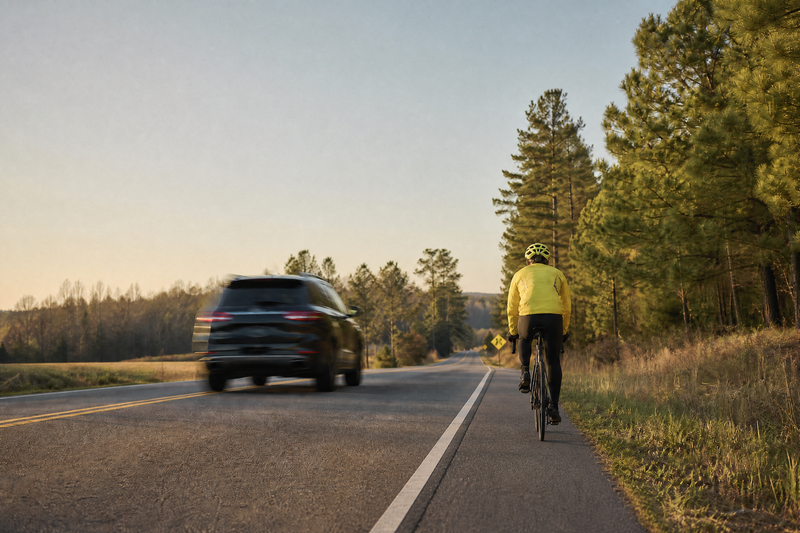
Whether I was looking at rural highways, school zones, or the state’s deadliest counties, the same relationship appeared over and over again. As speed increased, the odds that a vulnerable road user crash ended in a fatality increased dramatically.
That may sound obvious. Everyone knows speeding is dangerous. What surprised me was just how consistently speed shaped every other trend in the data.
For example, crashes occurring on roads posted above 60 mph were 118 percent more likely to be fatal than crashes on roads posted at 20 mph. That single relationship helps explain why some communities experience disproportionately high fatality rates despite having relatively few crashes, why school zones perform so much better than surrounding roads, and why rural North Carolina deserves far more attention in conversations about traffic safety.
This analysis is still ongoing, and many of these findings are preliminary. Even so, several themes are already impossible to ignore.
Looking Beyond the Largest Cities
Where crashes happen depends on how you measure them.
Major cities naturally experience the highest number of crashes simply because they have more people, more traffic, and more opportunities for collisions. Looking only at raw totals, places like Charlotte and Raleigh dominate the maps.
Once population is taken into account, however, a different picture emerges.
Many of North Carolina’s smaller communities and rural counties face a much higher risk of fatal crashes for pedestrians and cyclists than the state’s largest metropolitan areas. The Sandhills region stands out in particular.
Robeson County recorded the highest vulnerable road user fatality rate in the state between 2016 and 2024. Several surrounding legislative districts also ranked among North Carolina’s most dangerous for both pedestrians and cyclists. Similar patterns appeared across neighboring counties including Columbus, Scotland, Cumberland, and Hoke.
These findings reinforce an important point. The places experiencing the greatest risk are not always the places generating the biggest headlines.
School Zones Offer an Important Lesson
One of the most encouraging findings came from school zones. These areas bring together large numbers of children, parents, pedestrians, cyclists, and vehicles every day. On paper, they should create more opportunities for serious crashes.
Instead, they produced some of the safest outcomes in the dataset.
Within 200 feet of public schools during school hours, only 2.5 percent of vulnerable road user crashes were fatal. Expanding the analysis to a 1,000-foot school zone produced nearly identical results. Across the rest of North Carolina, more than 8.5 percent of vulnerable road user crashes were fatal during the same period. The difference is striking.
The data also revealed something equally important. Fatality rates increased significantly outside school hours, even though the roads and sidewalks remained the same. That suggests infrastructure tells only part of the story.
School zones combine lower speed limits, stronger enforcement, and an expectation that drivers slow down and pay attention. Together, those factors appear to create conditions where vulnerable road users are far more likely to survive when crashes occur.
While additional research is needed to isolate the precise causes, the evidence strongly suggests that managing vehicle speed plays a central role.
The Problem Is Growing
The long-term trends make these findings even more urgent. Since 2007, fatal vulnerable road user crashes in North Carolina have increased by nearly 72 percent.
Over the same period, total vulnerable road user crashes increased by just over 13 percent. In other words, crashes are not increasing at nearly the same rate as fatalities. The severity of crashes is increasing.
Other troubling patterns emerged as well. Fatal crashes involving impaired driving rose by 41 percent, while fatal hit-and-run crashes more than tripled during the study period. These trends point toward a transportation system where vulnerable road users face increasing consequences when crashes happen.
The Thread Connecting Everything
Every analysis seemed to circle back to the same conclusion. The counties with the highest fatality rates often contain faster roads. School zones become dramatically safer when speeds are reduced and enforcement increases. Rural communities face elevated risks despite lower traffic volumes. Existing research on pedestrian survival closely mirrors what appears in North Carolina’s own crash records.
None of these findings suggest there is a single solution to improving road safety. Infrastructure matters. Enforcement matters. Vehicle design matters. Driver behavior matters.
Yet throughout this analysis, speed consistently emerged as the factor connecting them all. That is perhaps the clearest lesson from 17 years of North Carolina crash data.
If we want fewer vulnerable road users to die on our roads, reducing speed must remain at the center of the conversation.